XVCF: Exquisite Visualization of VCF Data from Genomic Experiments
XVCF: Exquisite Visualization of VCF Data from Genomic Experiments
Almuneef, G.; Aljouie, A.; Bokhari, Y.; Almazroa, A.; Rashid, M.
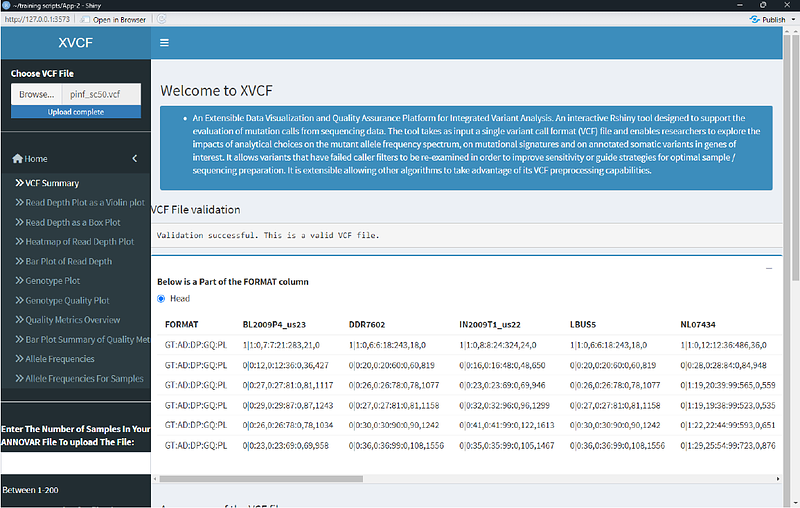
AbstractBackground High-throughput genomic analyses of germline and cancer genomes facilitate the identification of causal and actionable genetic variants. The recent advances in next-generation sequencing technology generated large-scale genomic and/or multi-omics datasets from different disease types or models. Owing to the huge volume of data coming out of genomic experiments, scientists are facing challenges in handling, manipulating, visualizing, and interpreting the data. Currently, available tools to visualize genetic variants from VCF files are not very user-friendly as most of them require knowledge of command line tools or scripts to install and run those software. Moreover, biologists or clinicians lack this knowledge of computer programming. Therefore, graphical user interface (GUI) based tools or software are needed to effectively summarize and visualize the huge volume of genomic data such as VCF data. Methods We have developed a Shiny App, interactive tool using the R programming language that utilizes other R packages like \'vcfR\' and \'maftools\' to visualize and generate quality control metrics for genetic data effectively and exquisitely. A key improvement is the addition of a user-friendly interface, providing researchers with an interactive way to explore VCF or Cancer genomics data. Our tool is powered by Shiny, making it even easier for researchers to analyze and visualize genomic variation data using a GUI. Researchers can upload their datasets and customize the analysis parameters to suit their specific research needs. Results A user-friendly interactive tool has been developed for the summarization and visualization of data related to genomic variation research. The application features an easy and friendly interface, allowing users to perform various functions such as data loading, summarization, and visualization interactively. XVCF offers an easy-to-use GUI platform to read genetic variant data (annotated or unannotated) and extract useful information such as read depth, mapping quality, genotype, quality control summary, and allele frequency from unannotated data. In the second module of XVCF, the cancer genomic data (annotated, so far supported by ANNOVAR) is analyzed using \'maftools\' to produce oncoplot, comparison of mutational load across different TCGA datasets, gene summary, etc. XVCF is available for free download from https://github.com/rashidma/XVCF. Conclusion XVCF Shiny web application can serve as a robust visualization and quality control GUI platform for the germline and cancer genomics dataset. We expect this tool will be immensely useful for researchers with less computational or technical knowledge. Being a shiny R package, XVCF can be installed across different operating systems and utilize different computer hardware configurations.